Labels
#Assessment
(1)
#Biculturalism
(6)
#Leadership
(1)
#LearningEnvironment
(3)
#LearningProgramme
(2)
#ManageDiversity
(3)
#ProfessionalDevelopment
(15)
#ProfessionalRelationships
(8)
#PromotingWellBeing
(2)
#TeachingInquiry
(5)
#TeachingTechniques
(3)
Our Code
(1)
Robyn
(5)
Robyn64
(2)
STP 1
(2)
STP 2
(6)
STP 3
(5)
STP 4
(4)
STP 5
(3)
STP 6
(2)
Wednesday, 21 March 2018
Thursday, 8 March 2018
Techie Session
8 March 2018
This afternoon I participated in a Techie Session at school. I worked on Google Draw with Edie and Georgia and Kidpix Deluxe 3x with Sheryl and Hine. We had 20 minutes to explore each digital tool.
Google Draw
This afternoon I participated in a Techie Session at school. I worked on Google Draw with Edie and Georgia and Kidpix Deluxe 3x with Sheryl and Hine. We had 20 minutes to explore each digital tool.
Google Draw
Draw, orbit and push-pull: make anything you can imagine in Google Draw.
There are tools to create 3D shapes that can be stretched and transformed into objects of interest. It is easy to learn and incredibly fun to use.
Insert photos easily add your personal touch.
Kidpix Deluxe 3D
I thought I knew all there was to know about Kidpix ... so I thought.
Yes, an "Aha" moment. We made slideshows using backgrounds with animations and sound.
Wednesday, 28 February 2018
Number Bonds
What?
I am learning that Counting is out and Chunking is in. Number Bonds are a way of teaching students how numbers can join together and how they can be broken down into component parts. Number bonds are also often referred to as 'number pairs'. They are simply the pairs of numbers that make up a given number.
1 + 9, 2 + 8, 3 + 7, 4 + 6, 5 + 5
1 + 19, 2 + 18, 3 + 17, 4 + 16, 5 + 15
Children start to learn about number bonds in the Foundation stage, when they might be given a number, such as 5, and then asked to select two groups of objects that will add up to that number.
Children are expected to know number bonds to 10 and number bonds to 20. Children by now need to be very confident with their number bonds to 20. They need to be able to work out number bonds to 100. They also need to be confident with the corresponding subtraction facts (for example: 20 - 13 = 7).
So what?
What appeals is the idea of MODEL - Story - Reptition
What now?
I am learning that Counting is out and Chunking is in. Number Bonds are a way of teaching students how numbers can join together and how they can be broken down into component parts. Number bonds are also often referred to as 'number pairs'. They are simply the pairs of numbers that make up a given number.
1 + 9, 2 + 8, 3 + 7, 4 + 6, 5 + 5
1 + 19, 2 + 18, 3 + 17, 4 + 16, 5 + 15
Children start to learn about number bonds in the Foundation stage, when they might be given a number, such as 5, and then asked to select two groups of objects that will add up to that number.
Children are expected to know number bonds to 10 and number bonds to 20. Children by now need to be very confident with their number bonds to 20. They need to be able to work out number bonds to 100. They also need to be confident with the corresponding subtraction facts (for example: 20 - 13 = 7).
So what?
What appeals is the idea of MODEL - Story - Reptition
What now?
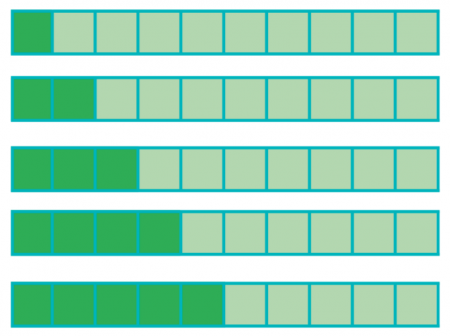
Teach number bonds in a variety of ways. When learning number bonds to 5 or 10 it is always good to use pictorial representation, so show rows of blocks shaded like this to make the concept clear:

It is also a good idea to show children the connection between number bonds to ten, twenty and one hundred, for example:

Knowledge of number bonds is essential when it comes to harder calculations involving addition and subtraction (for example, children learn to bridge numbers to help them add numbers mentally), so it is vital children get a firm grounding in this from Years 1 to 3.
Friday, 26 January 2018
Learning in a Changing World - Cyclone PL 2018
Cyclone PL
The why, how and what for eLearning Digitial Fluency: Lynne Thomas
Digital Fluency PL 2018: Lynne Thomas
The why, how and what for eLearning Digitial Fluency: Lynne Thomas
Digital Fluency PL 2018: Lynne Thomas
Thursday, 16 November 2017
He Papa Tikanga Maaori
He Papa Tikanga
Certificate in Tikanga Māori
This year I participated in Certificate for Tikanga Maaori delivered by Te Wananga o Aotearoa.
Progamme Overview:
He Papa Tikanga gives you insight into a Maaori worldview. You learn about traditions, concepts, values and protocols and undertsand why Maaori do things in a certain way. How to apply some of these concepts in your home, school, workplace and community. It challenges thinking and your own beliefs and values and how they relate to other cultures. We had a Kaititaki (support person) David. David helped us through each component. He was amazing and great singer.
There were 4 components to work through.
We learnt:
- basic Maaori words
- values and belief systems
- Maaori traditions
- Maaori in a contemporary world
- Maaori philosophies and protocols
Powhiri is now an accepted practice. Not only do we see Powhiri on Marae but it is now common to Powhiri-welcome visitors to schools and many workplaces. Visitors from other countries are often treated to a Powhiri experience.
I think if you have the time and opportunity then have a go - Certificate for Tikanga Maaori. Learning is at your own pace with lots of support from your Kaitiaki. there are no fees and you have 12 months to complete all four components. I totally recommend it!
Tuesday, 17 October 2017
Bruce Moody - Statistics
Statistics 17/ 10 / 17
Statistics helps us to make sense of the world by gathering and processing information. It should be informative. It is an investigation to see change from data. Statistical responses should have a purpose to it. Statistical investigation drives the data. Data drives a response.
Statistics is not just about statistical features, its about what we will do with the information (eg. taking an action). Statistics helps us to make an informed decision.
Students need to learn how to collect information efficiently in a way that fits the purpose.
Understanding how statistics are generated and the kinds of messages they can represent allows the children to critically examine
More or Most
We have to get children to work between More and Most
More is comparing part to whole. Most is comparing part to part.
Pie charts
Tally charts is the data collection tool and not the representation.
Tally charts is used for the organisation of the information.
Do activities that are physical. Make it real. We want to give children access to these ways of thinking. This is classic Piaget - Concrete literal before the Symbolic abstract.
Ways of modelling tally could be to take a coloured sticks and rearrange ...
Probability
One the real important ... Probability should arise from Statistics.
We predict is a statement made about probability. Probability decisions are made from data information.
What if...?
What is the likely-hood...?
What would we see if we went again?
Probability is in response to things that have happened.
Is it possible ...? Students are deducing
Students need to experience variation and know that it is normal and acceptable. Variability is normal. What you get is what you get. For example flip a coin 100 times what is the probability of getting 50% Heads and 50% tails the average is 7.8%.
Counter intuitive
Basing a probability decision on statistical facts is good.
Statistics helps us to make sense of the world by gathering and processing information. It should be informative. It is an investigation to see change from data. Statistical responses should have a purpose to it. Statistical investigation drives the data. Data drives a response.
Statistics is not just about statistical features, its about what we will do with the information (eg. taking an action). Statistics helps us to make an informed decision.
Students need to learn how to collect information efficiently in a way that fits the purpose.
Understanding how statistics are generated and the kinds of messages they can represent allows the children to critically examine
More or Most
We have to get children to work between More and Most
More is comparing part to whole. Most is comparing part to part.
Pie charts
Tally charts is the data collection tool and not the representation.
Tally charts is used for the organisation of the information.
Do activities that are physical. Make it real. We want to give children access to these ways of thinking. This is classic Piaget - Concrete literal before the Symbolic abstract.
Ways of modelling tally could be to take a coloured sticks and rearrange ...
Probability
One the real important ... Probability should arise from Statistics.
We predict is a statement made about probability. Probability decisions are made from data information.
What if...?
What is the likely-hood...?
What would we see if we went again?
Probability is in response to things that have happened.
Is it possible ...? Students are deducing
Students need to experience variation and know that it is normal and acceptable. Variability is normal. What you get is what you get. For example flip a coin 100 times what is the probability of getting 50% Heads and 50% tails the average is 7.8%.
Counter intuitive
Basing a probability decision on statistical facts is good.
Sunday, 10 September 2017
SAMR
connecting with parents
you cant do it all of the time
planning and connecting
thinglink, Book creator and padlet, poplet
Creating digitally fluent learners The SAMR model
SAMR Model is the support system to do that. Curriculum models are there to compliment each other
Redefining using social media
Tools like twitter and youtube can give you the option to view other opinions.
Kids are communicating with the community and outside community
Taking the risk - be a risk taker
Embedding the plan is about giving it a go.
Produce an outcome that is meaningful.
Make the mistakes to learn something new.
Subscribe to:
Posts (Atom)